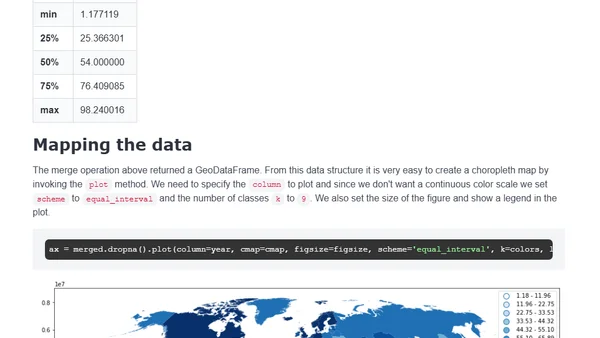
World population growth through time
A technical tutorial on creating animated cartograms in R to visualize global population growth and distribution from 1800 to 2100.
A workshop tutorial on using Pangeo tools and Met Office weather data for business decision-making, like a ferry schedule.
An introduction to graph theory using examples from Facebook, Game of Thrones, and social relationships to explain network concepts.
A guide on how to customize ggplot graphs to match your company's visual branding, making your data visualizations stand out and be more impactful.
A technical tutorial on using the R plotly package to create interactive Gantt charts for project planning, specifically for a PhD thesis.
A tutorial on creating an animated world population cartogram from 1800 to 2100 using R, open data, and open-source geospatial libraries.
Introduces the 'sabre' R package for quantitatively comparing two categorical maps or regionalizations to measure spatial similarity.
A data science tutorial using Leaflet to map Wellington bus locations and lateness, analyzing real-time transit data with R.
A tutorial on creating a glass-shattering animation in R using the gganimate package to announce a monthly data science book giveaway winner.
A technical tutorial on generating color palettes in R using various packages, inspired by movie posters and applied to Archer TV show artwork.
A tutorial on using R packages to download, process, and visualize global life expectancy data from the World Bank API.
A technical analysis of Stack Overflow's 2018 survey data, visualizing global developer response rates per capita using Python, pandas, and GeoPandas.
A data scientist shares ideas for micro-projects for the Summer of Data Science, including manual annotation, package comparisons, and resource curation.
A technical tutorial on using Python, pandas, and geospatial data to create a world map visualizing the origins of metal bands from a dataset.
Presentation slides for a Power BI tips and tricks talk at DataBISummit, available for download.
A data visualization tutorial using Flourish to create an animated 'horserace' chart tracking NBA team win percentages.
Introducing AstroImages.jl, a Julia package for visualizing astronomical images from FITS files.
A tutorial on creating a choropleth world map in Python with GeoPandas to visualize global internet usage percentages.
A technical tutorial on creating US maps with R, including Alaska and Hawaii as properly scaled insets using the sf and tmap packages.
A roundup post celebrating the CRANniversary of the ggraph R package, highlighting its features and community tutorials for network visualization.