The world (population) is changing
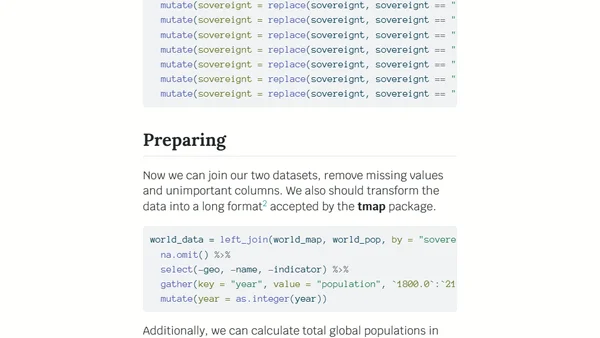
Read OriginalThis technical tutorial demonstrates how to generate an animated cartogram visualizing global population changes from 1800 to 2100. It provides a step-by-step guide using the R programming language, open data from Gapminder, and packages like sf, dplyr, and cartogram for geospatial data manipulation and visualization, emphasizing reproducibility and open-source methodology.
Comments
No comments yet
Be the first to share your thoughts!
Browser Extension
Get instant access to AllDevBlogs from your browser
Top of the Week
1
The Beautiful Web
Jens Oliver Meiert
•
2 votes
2
When your coding agent doesn’t understand your project, you’ll get junk
Benjamin Cane
•
1 votes
3
LLM Use in the Python Source Code
Miguel Grinberg
•
1 votes
4
Wagon’s algorithm in Python
John D. Cook
•
1 votes
5
An example conversation with Claude Code
Dumm Zeuch
•
1 votes