Leaflet and buses
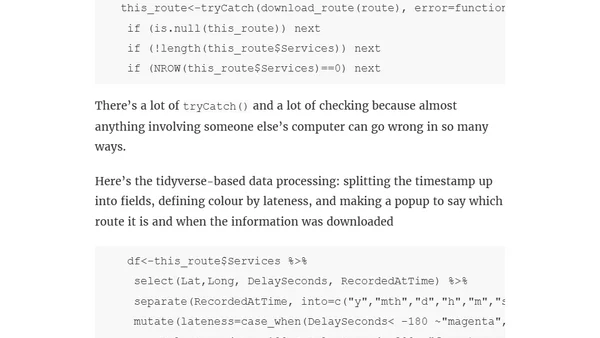
Read OriginalThis technical article details a data science project analyzing Wellington's bus system. It explains how to scrape real-time bus location and delay data from an unofficial API, handle rate limiting with R's ratelimitr package, process the data using tidyverse, and visualize the results on an interactive map using the Leaflet library.
Comments
No comments yet
Be the first to share your thoughts!
Browser Extension
Get instant access to AllDevBlogs from your browser
Top of the Week
1
The Beautiful Web
Jens Oliver Meiert
•
2 votes
2
When your coding agent doesn’t understand your project, you’ll get junk
Benjamin Cane
•
1 votes
3
LLM Use in the Python Source Code
Miguel Grinberg
•
1 votes
4
Wagon’s algorithm in Python
John D. Cook
•
1 votes
5
An example conversation with Claude Code
Dumm Zeuch
•
1 votes