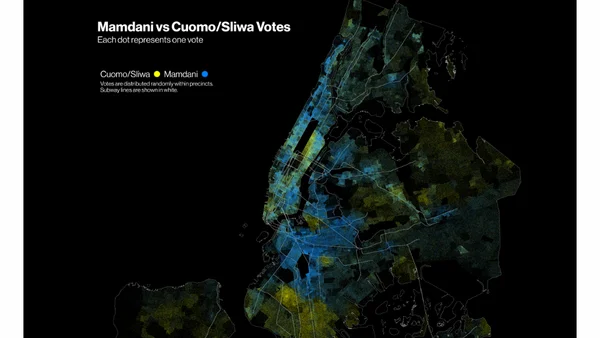
Mamdani vs Sliwa and Cuomo
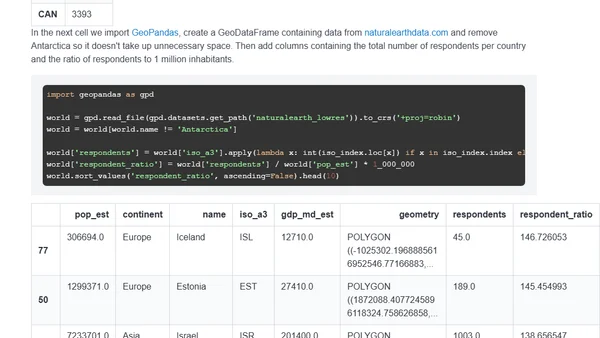
A technical analysis of NYC mayoral election results using R, spatial data, and GIS techniques to create maps visualizing precinct-level voting patterns.
A data visualization project mapping the world's countries by the first letter of their names using R and ggplot2, presented as small multiples.
A technical analysis of Stack Overflow's 2018 survey data, visualizing global developer response rates per capita using Python, pandas, and GeoPandas.