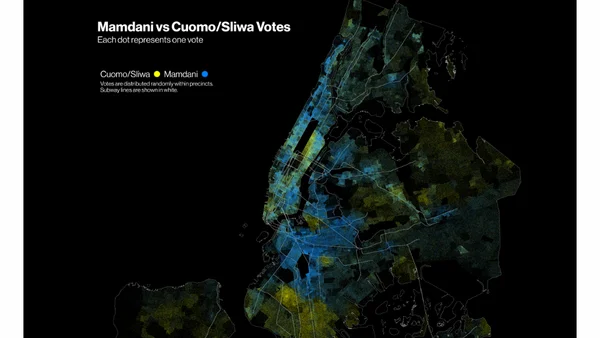
Mamdani vs Sliwa and Cuomo
Read OriginalThe article details a data science project analyzing New York City mayoral election results. It explains using R, the sf package, and spatial data (precinct results, borough maps, MTA GTFS data) to create choropleth and dot-density maps visualizing the Mamdani vs. Sliwa/Cuomo vote share. It discusses technical challenges of spatial representation, color scales, and the benefits of R for data manipulation in this context.
0 comments
Comments
No comments yet
Be the first to share your thoughts!
Browser Extension
Get instant access to AllDevBlogs from your browser
Top of the Week
1
The Beautiful Web
Jens Oliver Meiert
•
2 votes
2
When your coding agent doesn’t understand your project, you’ll get junk
Benjamin Cane
•
1 votes
3
LLM Use in the Python Source Code
Miguel Grinberg
•
1 votes
4
Wagon’s algorithm in Python
John D. Cook
•
1 votes
5
An example conversation with Claude Code
Dumm Zeuch
•
1 votes