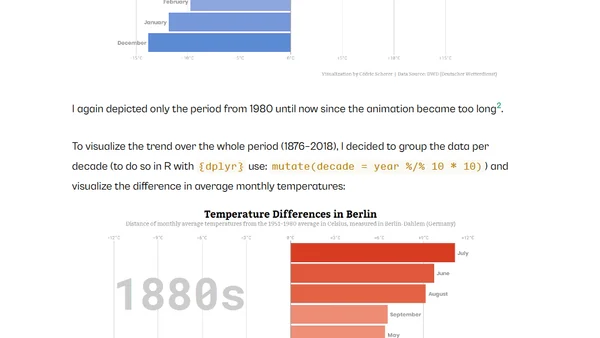
Visualizing Temperatures in Berlin with Bar Chart Races
A tutorial on creating animated bar chart races in R using gganimate, applied to visualize historical temperature trends in Berlin.
A tutorial on using R to reproduce and analyze map projection distortions, focusing on the Web Mercator projection with reproducible code.
A tutorial on creating a glass-shattering animation in R using the gganimate package to announce a monthly data science book giveaway winner.