Life (expectancy), animated
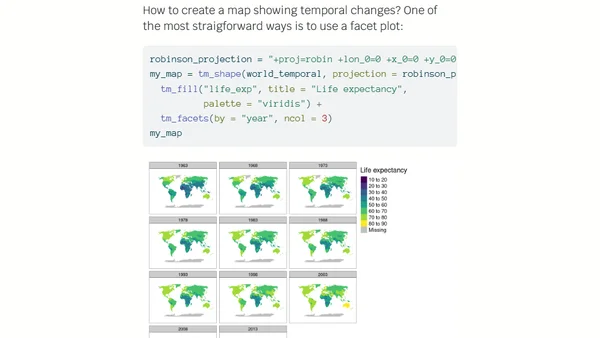
Read OriginalThis technical article demonstrates a data analysis workflow in R, using packages like wbstats, dplyr, and ggplot2 to fetch and visualize World Bank socio-economic data. It provides a step-by-step guide to creating time-series plots of life expectancy across multiple countries, focusing on data manipulation and visualization techniques.
Comments
No comments yet
Be the first to share your thoughts!
Browser Extension
Get instant access to AllDevBlogs from your browser
Top of the Week
1
The Beautiful Web
Jens Oliver Meiert
•
2 votes
2
When your coding agent doesn’t understand your project, you’ll get junk
Benjamin Cane
•
1 votes
3
LLM Use in the Python Source Code
Miguel Grinberg
•
1 votes
4
Wagon’s algorithm in Python
John D. Cook
•
1 votes
5
An example conversation with Claude Code
Dumm Zeuch
•
1 votes