Halloween in the Round
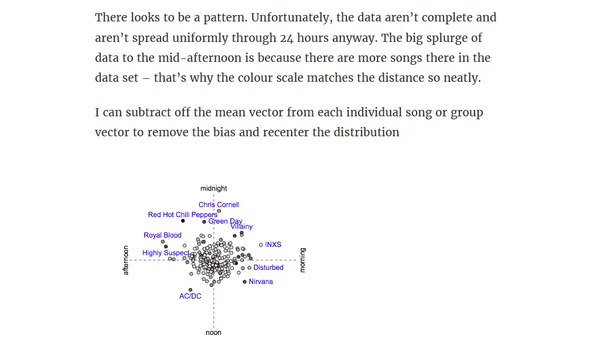
Analyzing pedestrian fatality data using polar coordinate visualizations to reveal cyclical patterns in daily accident counts.
A guide to creating and using interactive dual-axis line charts in Plotly for Python, with examples comparing sensor data.
A tutorial demonstrating how to use the R `slider` package for rolling window analysis, using NFL quarterback performance data as an example.
A technical walkthrough of visualizing and improving a graph of Auckland bus cancellation data using R, focusing on data representation and coding techniques.
A technical article explaining polynomial distributed lag models for regularization in time-series analysis, including code archaeology and R implementation.
A cheat sheet covering fundamental Prometheus concepts including metrics, labels, time series, and the scraping process.
Explains why Prometheus is fundamentally a monitoring system, not just a time-series database, and clarifies its design and query behavior.
Introducing pq, a Rust-based tool for parsing and querying log files as time series data with PromQL-like syntax.
A guide to Prometheus's aggregation functions like avg_over_time and sum_over_time for analyzing time series data, with pseudocode examples.
A humorous R programming tutorial combining tibbletime, tidyquant, and magick packages to create playful data visualizations with pop culture references.
Part 2 of a tutorial on using RNNs with stock symbol embeddings to predict prices for multiple stocks.
A speaker's experience presenting the Gnocchi monitoring tool at a Paris meetup, addressing its independence from OpenStack.
A technical guide on using Kibana Timelion to calculate and visualize the difference between current data and data from one week ago.
A data analysis of a radio station's song rotation patterns using vector math and statistical methods to test anecdotal claims about repetitive playtimes.
A technical article presenting a mathematical function for creating smooth, differentiable pulses, with R code examples.
Announcing Gnocchi 1.0, a scalable time-series database for storing cloud infrastructure metrics and resources via a REST API.
Explains how to use the Adobe Analytics API and R for statistical anomaly detection in time-series marketing data.
A technical guide on using R's xts and ggplot2 packages to process and visualize time-series data from field instruments.
A guide to properly labeling time-based axes in Excel by understanding how Excel stores time as fractions of a day.