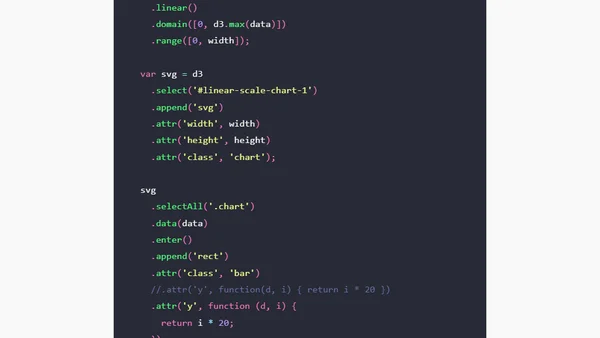
D3 Basics: The Linear Scale
A tutorial on using D3.js linear scales to map data domains to visual ranges, demonstrated with a Fibonacci sequence chart.
Critique of non-standard CSS text masking and advocacy for using SVG as a standards-compliant alternative for text effects.
A technical guide on integrating D3.js data visualizations into the Octopress blogging platform, including a working bar chart example.
Performance comparison showing CSS gradients outperform SVG backgrounds in dynamic effects due to browser rendering overhead.
A tutorial on using Clojure to programmatically color SVG maps of Europe, demonstrating XML parsing and manipulation.
Creating CSS reflections in Firefox using -moz-element() and SVG masks, as an alternative to -webkit-box-reflect.
Discusses the W3C's new HTML5 logo and the debate over using 'HTML5' as a buzzword for a broader set of web technologies, analyzing its impact on developer clarity.
A developer shares a public-domain SVG world map for visualizing country-specific data, created as a static alternative to matplotlib basemap.
A critical analysis of using pure CSS for complex illustrations, arguing it's a misuse of the technology compared to more suitable alternatives like SVG.
Opera browser achieves a near-perfect 100/100 score on the new Acid 3 web standards test, leading other major browsers in rapid compliance.
A technical article explaining how to fix missing arrowheads in SVG diagrams generated by Batik by adjusting marker properties.
A developer details solving the challenge of generating HTML imagemaps from SVG hyperlinks using the Apache Batik toolkit, including patching and fixing coordinate issues.