D3 Basics: The Linear Scale
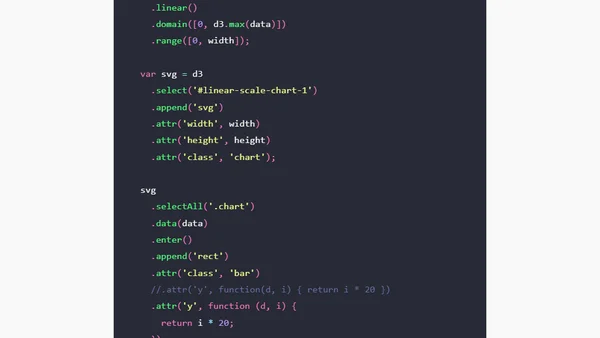
Read OriginalThis article provides a technical tutorial on implementing linear scales in D3.js. It explains how to map a continuous data domain (using a Fibonacci sequence as an example) to an output range for visualization, including code examples for creating a basic chart with SVG elements.
Comments
No comments yet
Be the first to share your thoughts!
Browser Extension
Get instant access to AllDevBlogs from your browser
Top of the Week
1
The Beautiful Web
Jens Oliver Meiert
•
2 votes
2
When your coding agent doesn’t understand your project, you’ll get junk
Benjamin Cane
•
1 votes
3
LLM Use in the Python Source Code
Miguel Grinberg
•
1 votes
4
Wagon’s algorithm in Python
John D. Cook
•
1 votes
5
An example conversation with Claude Code
Dumm Zeuch
•
1 votes