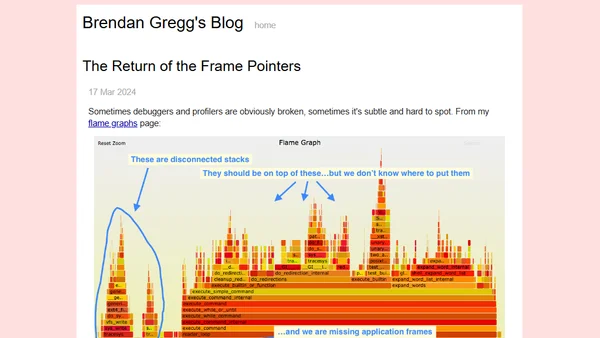
The Return of the Frame Pointers
Explains how missing frame pointers in libc break profilers and debuggers, causing incorrect stack traces and misleading flame graphs.
Introduces ETTrace, an open-source iOS performance debugging tool that improves upon Xcode's Time Profiler for identifying bottlenecks.
A guide to using iOS Performance Trace Profiles to debug performance issues like UI hangs and slow code that cannot be reproduced internally.
Part 3 of a series on writing a .NET profiler in C#, focusing on creating a source generator to automate boilerplate code for the profiling API.
A developer profiles and optimizes a Python interpreter for a custom language, focusing on performance bottlenecks and benchmarking against a naive Fibonacci program.
Introduces PerfCollectProfiler, a BenchmarkDotNet plugin for profiling .NET applications on Linux and exporting trace data for performance analysis.
A technical guide on implementing a .NET profiler in C#, focusing on mapping COM objects to .NET instances and using UnmanagedCallersOnly.
GraalVM 21.2+ now supports JDK Flight Recorder (JFR) in native binaries, enabling low-overhead profiling for compiled Java applications.
Explores the need for and methods of correlating different observability signals like metrics, logs, and traces for effective system monitoring.
An interview discussing Python performance, profiling, optimization, the GIL, and related technical topics.
A software engineer argues that effective performance optimization requires understanding system bottlenecks and applying a scientific, evidence-based approach.
A developer shares their experience presenting a talk on Python profiling at the FOSDEM 2020 open-source conference.
A tutorial on profiling Python applications running inside Docker containers using the py-spy tool to generate flame graphs.
A guide on using the React DevTools Profiler to measure app performance, including a warning to profile in production mode for accurate results.
A guide to profiling concurrent .NET applications using BenchmarkDotNet's ConcurrencyVisualizerProfiler and visualizing the results in Visual Studio.
A deep dive into optimizing WinDbg's DML parser, revealing a performance bottleneck in StringBuilder character access.
A .NET performance engineer details using BenchmarkDotNet and PerfView to analyze and optimize a real-world ML.NET benchmark.
A guide to profiling and debugging Go applications running inside Docker containers using pprof and other tools.
A developer discusses the trade-offs between writing simple, clear code and optimizing for performance, using a real-world example of inefficient vector growth in R.