Monitor ClickHouse with Prometheus & Grafana
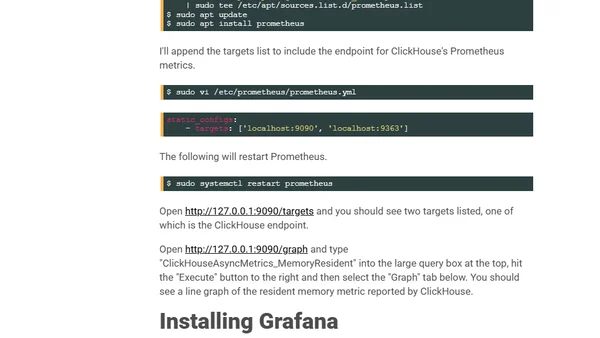
Read OriginalThis article provides a detailed, step-by-step tutorial for monitoring the ClickHouse database using Prometheus for metrics collection and Grafana for visualization. It covers installing ClickHouse, enabling its Prometheus metrics endpoint, installing and configuring Prometheus to scrape those metrics, and includes command-line examples and configuration snippets.
0 comments
Comments
No comments yet
Be the first to share your thoughts!
Browser Extension
Get instant access to AllDevBlogs from your browser
Top of the Week
1
The Beautiful Web
Jens Oliver Meiert
•
2 votes
2
When your coding agent doesn’t understand your project, you’ll get junk
Benjamin Cane
•
1 votes
3
LLM Use in the Python Source Code
Miguel Grinberg
•
1 votes
4
Wagon’s algorithm in Python
John D. Cook
•
1 votes
5
An example conversation with Claude Code
Dumm Zeuch
•
1 votes