Create a dynamic dashboard with R, flexdashboard, and Shiny
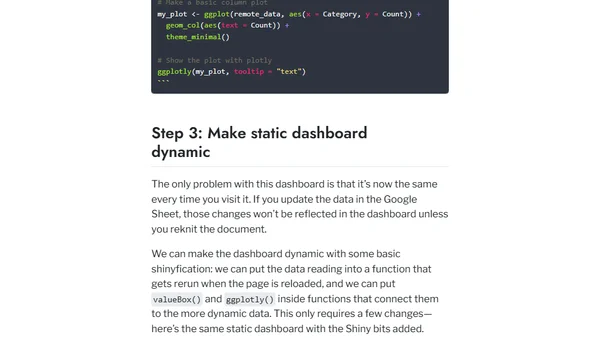
Read OriginalThis technical article provides a step-by-step guide to creating a dynamic dashboard in R. It demonstrates how to use the flexdashboard package with Shiny components, fetch data from a public Google Sheet, and visualize it with ggplot2 and plotly to create interactive value boxes and charts.
Comments
No comments yet
Be the first to share your thoughts!
Browser Extension
Get instant access to AllDevBlogs from your browser
Top of the Week
1
The Beautiful Web
Jens Oliver Meiert
•
2 votes
2
When your coding agent doesn’t understand your project, you’ll get junk
Benjamin Cane
•
1 votes
3
LLM Use in the Python Source Code
Miguel Grinberg
•
1 votes
4
Wagon’s algorithm in Python
John D. Cook
•
1 votes
5
An example conversation with Claude Code
Dumm Zeuch
•
1 votes