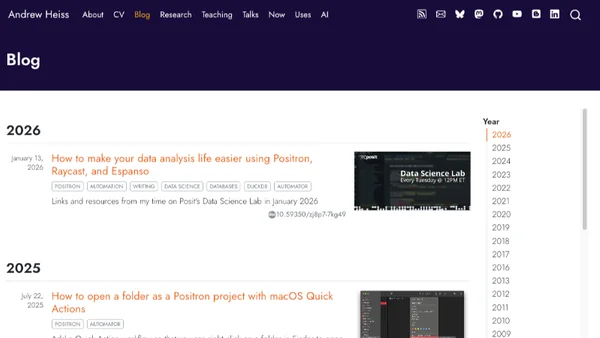
How to make your data analysis life easier using Positron, Raycast, and Espanso
A data scientist shares workflow automation tools and custom settings for Positron, Raycast, and Espanso to streamline data analysis tasks.
Andrew Heiss is a researcher and educator focused on data visualization, causal inference, and applied statistics using R and Bayesian methods. He writes extensively about reproducible research, GIS, and analytical workflows, and teaches data science and social science methods.
55 articles from this blog
A data scientist shares workflow automation tools and custom settings for Positron, Raycast, and Espanso to streamline data analysis tasks.
A guide to creating a macOS Quick Action that lets you right-click any folder in Finder to open it as a project in Positron (an R IDE).
A tutorial on using Positron's Connections Pane to connect to and query DuckDB databases efficiently, especially for handling large datasets.
A guide on using Positron IDE to SSH into local Docker containers for running R code, improving reproducibility and environment management.
How to open Quarto/Markdown files in external macOS apps from Positron or VS Code to access better native writing tools and spellchecking.
A tutorial on creating a choropleth map with a histogram legend in R using ggplot2, sf, and patchwork to better visualize data distribution.
A technical tutorial on using R and the sf package to adjust map boundaries, specifically addressing the Crimea region's political representation in geographic data.
A technical tutorial on creating interactive world maps with USAID foreign aid data using Observable Plot and JavaScript.
A guide to comparing survey sample demographics with national population data using R, covering both classical and Bayesian statistical methods.
A tutorial on using R to parse Apple Music XML data and create personalized listening statistics similar to Spotify Wrapped.
A technical guide on using Quarto and R to programmatically generate and render markdown content for election results websites.
Positron is a new data science IDE from Posit that combines features from RStudio and VS Code, offering a specialized environment for R and Python.
Using R and geospatial data to calculate and compare the proportion of coastline to land borders for US states, with Rhode Island as a key example.
Using R simulations to calculate birthday probabilities instead of complex probability math, with code examples.
A tutorial using custom animations to visually explain how dplyr's mutate(), summarize(), group_by(), and ungroup() functions work in R.
Explains key causal inference estimands (ATE, ATT, ATU) and how to calculate them using observational data, with a focus on R and the potential outcomes framework.
A tutorial on creating a custom API using Make and the R package {plumber} to serve live data for dynamic dashboards in Quarto with Observable JS.
A technical guide on using multibib and Quarto to create separate bibliographies for a main document and an appendix in academic writing.
Explains the Dirichlet distribution as a multivariate extension of the Beta distribution, with applications in Bayesian statistics and regression models.
A guide to manually generating predicted values for logistic regression using matrix multiplication in R, as an alternative to the predict() function.