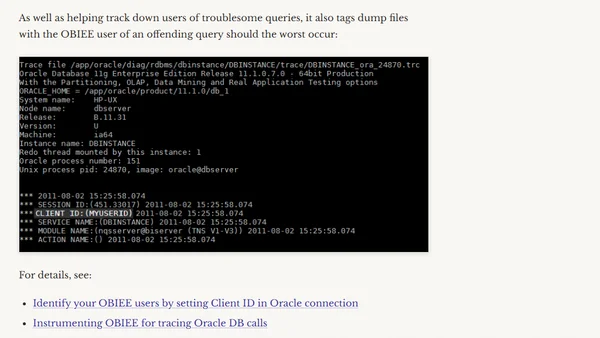
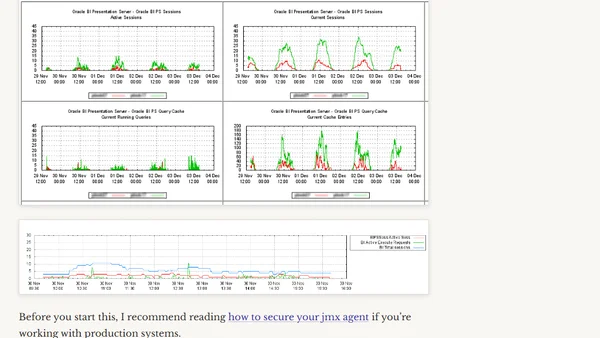
Instrumenting OBIEE - the final chapter
Explains how to instrument OBIEE database connections for improved performance diagnostics and user session tracking.
Explains the importance of defining CLIENT_ID in OBIEE for user query tracking and troubleshooting database calls.
Introducing Glimpse for PHP, a client-side debugging tool that provides insights into server-side operations, similar to Firebug for the client.
A technical guide on using gnuplot to visualize OBIEE performance monitoring data captured from JMX metrics.
A technical guide on using JMX and jmxsh to monitor and collect performance data from OBIEE (Oracle Business Intelligence) systems.
A technical guide on monitoring OBIEE systems using JMX, shell scripting, and gnuplot for metrics collection and real-time graphing.
A technical guide on integrating custom OBIEE performance monitoring graphs into Oracle Application Server (OAS) using Apache configuration.
A low-cost method for monitoring OBIEE 10g systems using built-in JMX, jconsole, and custom scripting for data export and visualization.
Explains how to use Windows Azure Diagnostics with PHP to collect and analyze logs, traces, and performance counters from cloud applications.
Explains how to use the REST interface in GlassFish v3 for server monitoring and management, supporting JSON, XML, and HTML outputs.
A technical guide on using JConsole and JMX for monitoring OBIEE server performance, including remote connection setup.