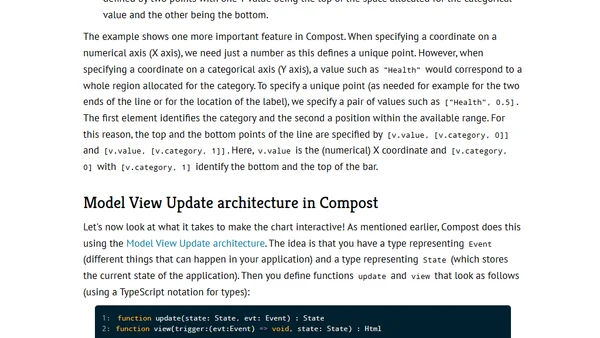
Creating interactive You Draw bar chart with Compost
Read OriginalThis article explains how to build an interactive 'You Draw It' style bar chart where users guess data values before revealing the actual figures. It introduces the Compost.js library, a minimalist JavaScript library for composing data visualizations from simple components, contrasting it with tools like D3.js and Vega. The tutorial walks through creating a basic bar chart and adding interactivity, using UK budget data as an example.
Comments
No comments yet
Be the first to share your thoughts!
Browser Extension
Get instant access to AllDevBlogs from your browser
Top of the Week
1
The Beautiful Web
Jens Oliver Meiert
•
2 votes
2
When your coding agent doesn’t understand your project, you’ll get junk
Benjamin Cane
•
1 votes
3
LLM Use in the Python Source Code
Miguel Grinberg
•
1 votes
4
Wagon’s algorithm in Python
John D. Cook
•
1 votes
5
An example conversation with Claude Code
Dumm Zeuch
•
1 votes