Plotting Points as Images in ggplot
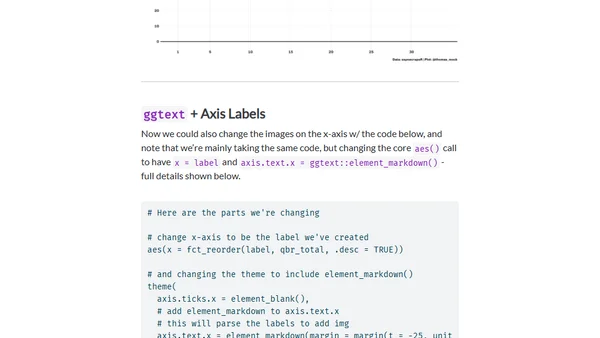
Read OriginalThis article demonstrates how to embed images as data points in ggplot2 visualizations using R. It walks through scraping NFL QBR data, creating image tags for player headshots, and building custom bar plots with team colors and embedded player photos. The tutorial covers data manipulation with dplyr, visualization techniques with ggplot2 and ggtext, and practical implementation of image embedding in statistical graphics.
0 comments
Comments
No comments yet
Be the first to share your thoughts!
Browser Extension
Get instant access to AllDevBlogs from your browser
Top of the Week
1
The Beautiful Web
Jens Oliver Meiert
•
2 votes
2
When your coding agent doesn’t understand your project, you’ll get junk
Benjamin Cane
•
1 votes
3
LLM Use in the Python Source Code
Miguel Grinberg
•
1 votes
4
Wagon’s algorithm in Python
John D. Cook
•
1 votes
5
An example conversation with Claude Code
Dumm Zeuch
•
1 votes