National Land Transport Plan graphs
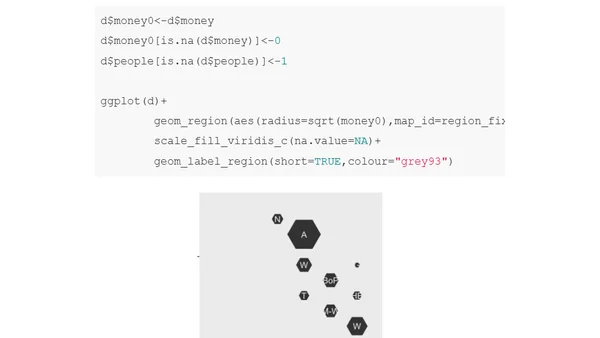
Read OriginalThis article details a data visualization project analyzing New Zealand's National Land Transport Plan. It uses the R programming language and the DHBins package to create hexmaps comparing regional transport expenditure, both in total and per capita. The post covers data cleaning, mapping techniques with ggplot2, and interprets the results, highlighting disparities in funding between regions.
0 comments
Comments
No comments yet
Be the first to share your thoughts!
Browser Extension
Get instant access to AllDevBlogs from your browser
Top of the Week
1
The Beautiful Web
Jens Oliver Meiert
•
2 votes
2
When your coding agent doesn’t understand your project, you’ll get junk
Benjamin Cane
•
1 votes
3
LLM Use in the Python Source Code
Miguel Grinberg
•
1 votes
4
Wagon’s algorithm in Python
John D. Cook
•
1 votes
5
An example conversation with Claude Code
Dumm Zeuch
•
1 votes