Housing unaffordability hexmaps
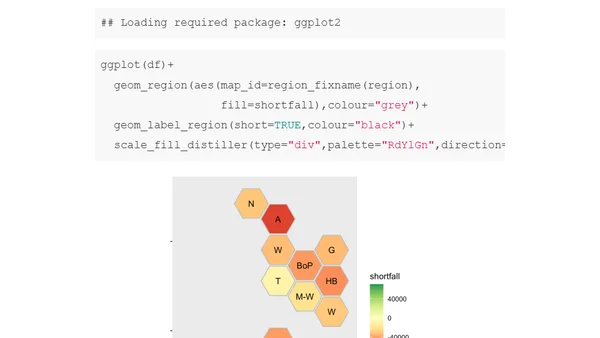
Read OriginalThis article presents a technical tutorial on creating hexmap visualizations of New Zealand housing affordability data using R's DHBins and ggplot2 packages. It compares hexmaps to traditional geographical maps, discussing the trade-offs in readability and data representation, and provides code examples for generating these visualizations with different color scales and labeling options.
0 comments
Comments
No comments yet
Be the first to share your thoughts!
Browser Extension
Get instant access to AllDevBlogs from your browser
Top of the Week
1
The Beautiful Web
Jens Oliver Meiert
•
2 votes
2
When your coding agent doesn’t understand your project, you’ll get junk
Benjamin Cane
•
1 votes
3
LLM Use in the Python Source Code
Miguel Grinberg
•
1 votes
4
Wagon’s algorithm in Python
John D. Cook
•
1 votes
5
An example conversation with Claude Code
Dumm Zeuch
•
1 votes