Displaying bus punctuality
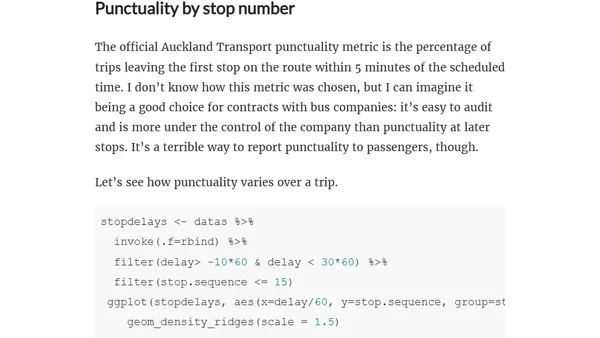
Read OriginalThis article details a data analysis project using the Auckland Transport real-time API to examine bus punctuality over a five-week period. It provides R code for loading CSV data, processing timestamps, and creating visualizations (like narrow boxplots) to show the distribution of delays relative to schedule, comparing weekdays and weekends.
0 comments
Comments
No comments yet
Be the first to share your thoughts!
Browser Extension
Get instant access to AllDevBlogs from your browser
Top of the Week
1
The Beautiful Web
Jens Oliver Meiert
•
2 votes
2
When your coding agent doesn’t understand your project, you’ll get junk
Benjamin Cane
•
1 votes
3
LLM Use in the Python Source Code
Miguel Grinberg
•
1 votes
4
Wagon’s algorithm in Python
John D. Cook
•
1 votes
5
An example conversation with Claude Code
Dumm Zeuch
•
1 votes