A short tutorial for decent heat maps in R
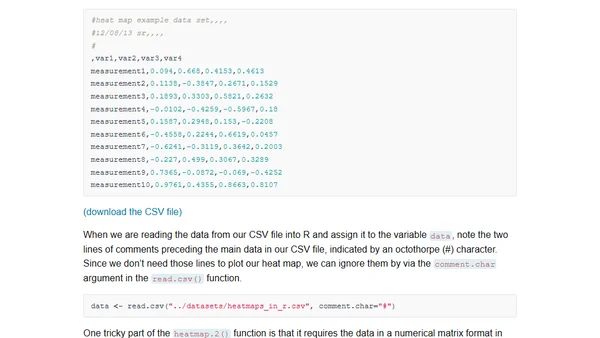
Read OriginalThis article provides a step-by-step tutorial for creating heat maps in R for exploratory data analysis. It covers installing required packages (gplots, RColorBrewer), reading and transforming data into matrix format, and customizing heat map visualizations using the heatmap.2() function, including color palettes and saving plots as PNG files.
0 comments
Comments
No comments yet
Be the first to share your thoughts!
Browser Extension
Get instant access to AllDevBlogs from your browser
Top of the Week
1
The Beautiful Web
Jens Oliver Meiert
•
2 votes
2
When your coding agent doesn’t understand your project, you’ll get junk
Benjamin Cane
•
1 votes
3
LLM Use in the Python Source Code
Miguel Grinberg
•
1 votes
4
Wagon’s algorithm in Python
John D. Cook
•
1 votes
5
An example conversation with Claude Code
Dumm Zeuch
•
1 votes