A short tutorial for decent heat maps in R
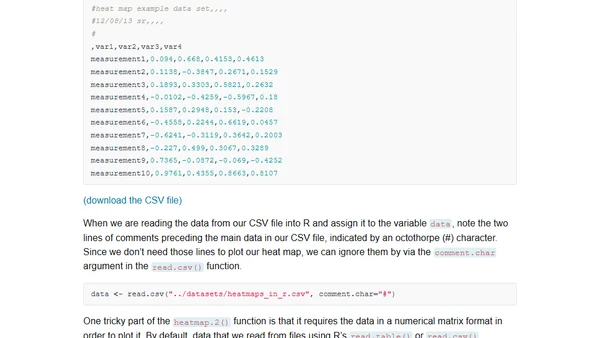
Read OriginalThis article provides a step-by-step tutorial for generating heat maps in R, focusing on the gplots package and heatmap.2() function. It covers installing required packages, reading and transforming data into a matrix, and customizing plots with color palettes. The guide includes code snippets and tips for saving outputs, making it useful for exploratory data analysis and publication-ready visualizations.
0 comments
Comments
No comments yet
Be the first to share your thoughts!
Browser Extension
Get instant access to AllDevBlogs from your browser
Top of the Week
1
The Beautiful Web
Jens Oliver Meiert
•
2 votes
2
When your coding agent doesn’t understand your project, you’ll get junk
Benjamin Cane
•
1 votes
3
LLM Use in the Python Source Code
Miguel Grinberg
•
1 votes
4
Wagon’s algorithm in Python
John D. Cook
•
1 votes
5
An example conversation with Claude Code
Dumm Zeuch
•
1 votes