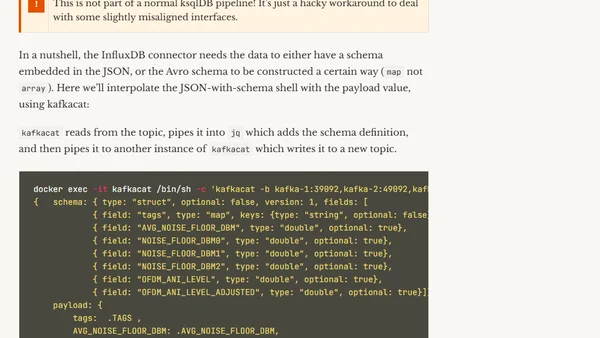
Monitoring Sonos with ksqlDB, InfluxDB, and Grafana
Read OriginalThis article details a project to monitor Sonos audio equipment by collecting and analyzing diagnostic data (Noise Floor and OFDM ANI levels) to troubleshoot connectivity issues. It explains the full technical stack, using curl and kafkacat to ingest data into Apache Kafka, processing it with ksqlDB, storing it in InfluxDB via Kafka Connect, and creating dashboards in Grafana for historical visualization.
0 comments
Comments
No comments yet
Be the first to share your thoughts!
Browser Extension
Get instant access to AllDevBlogs from your browser
Top of the Week
1
The Beautiful Web
Jens Oliver Meiert
•
2 votes
2
When your coding agent doesn’t understand your project, you’ll get junk
Benjamin Cane
•
1 votes
3
LLM Use in the Python Source Code
Miguel Grinberg
•
1 votes
4
Wagon’s algorithm in Python
John D. Cook
•
1 votes
5
An example conversation with Claude Code
Dumm Zeuch
•
1 votes