Graphing I/O data using gnuplot and Oracle V$SYSSTAT
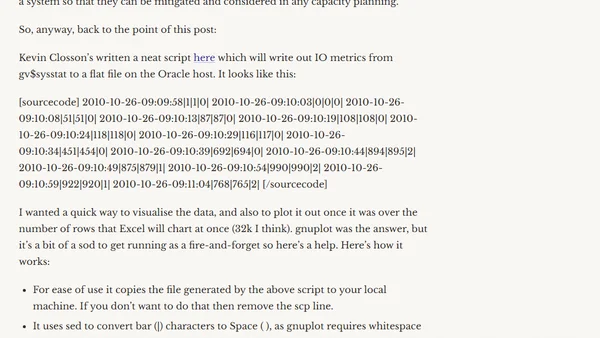
Read OriginalThis technical article explains how to graph I/O data from Oracle's V$SYSSTAT view using gnuplot. It addresses the limitations of averaged metrics in Enterprise Manager for bottleneck identification and capacity planning, providing a method to capture and visualize point-in-time I/O throughput with a script and gnuplot.
Comments
No comments yet
Be the first to share your thoughts!
Browser Extension
Get instant access to AllDevBlogs from your browser
Top of the Week
1
The Beautiful Web
Jens Oliver Meiert
•
2 votes
2
When your coding agent doesn’t understand your project, you’ll get junk
Benjamin Cane
•
1 votes
3
LLM Use in the Python Source Code
Miguel Grinberg
•
1 votes
4
Wagon’s algorithm in Python
John D. Cook
•
1 votes
5
An example conversation with Claude Code
Dumm Zeuch
•
1 votes