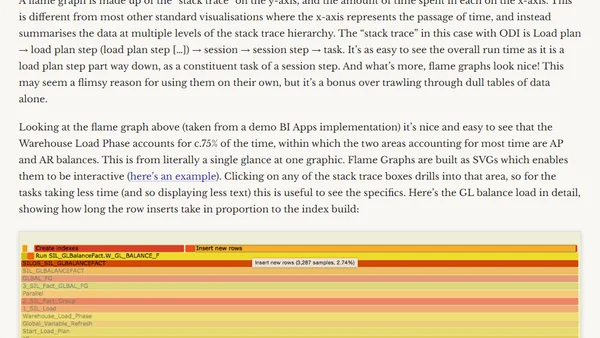
Analysing ODI performance with Flame Graphs
Read OriginalThis technical article explains how to apply Flame Graphs, a visualization tool popularized by Brendan Gregg, to analyze performance in Oracle Data Integrator (ODI). It details the process of generating stack traces from ODI's SNP tables to create interactive SVGs that help identify time-consuming tasks within complex load plan hierarchies, such as warehouse loads and index builds.
Comments
No comments yet
Be the first to share your thoughts!
Browser Extension
Get instant access to AllDevBlogs from your browser
Top of the Week
1
Webinar Series – SQL Server Indexing
Koen Verbeeck
•
1 votes
2
Risks and Limitations of AI in the Life Sciences
Jeremy Howard
•
1 votes
3
1M context is now generally available for Opus 4.6 and Sonnet 4.6
Simon Willison
•
1 votes
4
AI is my CMS
Chris Coyier
•
1 votes
5
When your coding agent doesn’t understand your project, you’ll get junk
Benjamin Cane
•
1 votes
6
LLM Use in the Python Source Code
Miguel Grinberg
•
1 votes