Visualizing Website Pathing With Sankey Charts
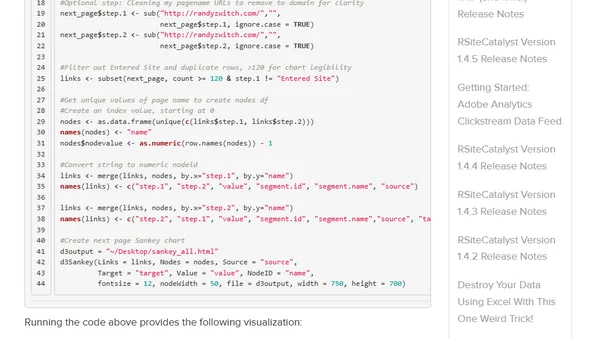
Read OriginalThis article provides a detailed tutorial on visualizing website user navigation paths using Sankey charts. It explains how to overcome limitations of standard analytics tools by using the Adobe Analytics API via RSiteCatalyst in R, with code examples for both single-page and multi-page pathing analysis. The content is focused on data processing, API usage, and creating interactive visualizations for technical web analytics.
Comments
No comments yet
Be the first to share your thoughts!
Browser Extension
Get instant access to AllDevBlogs from your browser
Top of the Week
1
The Beautiful Web
Jens Oliver Meiert
•
2 votes
2
When your coding agent doesn’t understand your project, you’ll get junk
Benjamin Cane
•
1 votes
3
LLM Use in the Python Source Code
Miguel Grinberg
•
1 votes
4
Wagon’s algorithm in Python
John D. Cook
•
1 votes
5
An example conversation with Claude Code
Dumm Zeuch
•
1 votes