Creating A Stacked Bar Chart in Seaborn
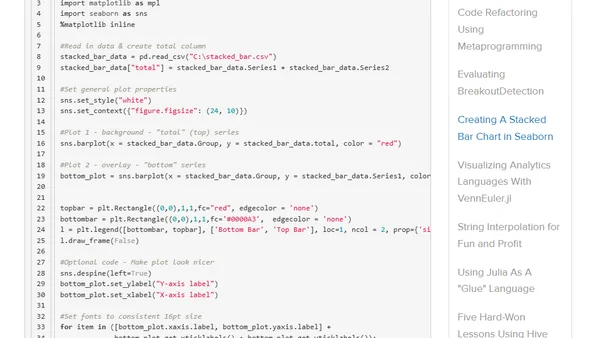
Read OriginalThis article details a method for creating a stacked bar chart in Seaborn, a Python data visualization library. It explains the author's process of overcoming the library's lack of a direct stacked bar function by manually summing data series and using Matplotlib's overlay capabilities, complete with a code example.
Comments
No comments yet
Be the first to share your thoughts!
Browser Extension
Get instant access to AllDevBlogs from your browser
Top of the Week
1
The Beautiful Web
Jens Oliver Meiert
•
2 votes
2
When your coding agent doesn’t understand your project, you’ll get junk
Benjamin Cane
•
1 votes
3
LLM Use in the Python Source Code
Miguel Grinberg
•
1 votes
4
Wagon’s algorithm in Python
John D. Cook
•
1 votes
5
An example conversation with Claude Code
Dumm Zeuch
•
1 votes