A quick introduction to ggplot()
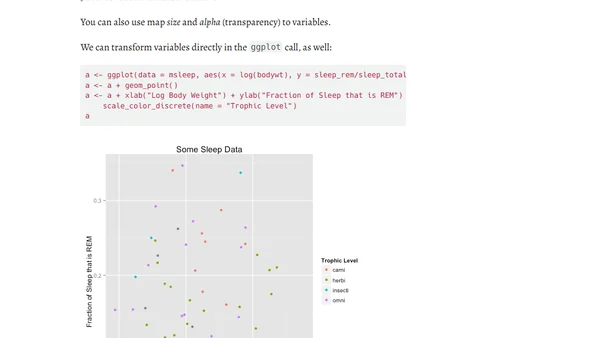
Read OriginalThis article provides a beginner-friendly introduction to the ggplot2 package in R. It demonstrates how to create plots using ggplot(), compares its syntax and output with base R graphics, and includes practical examples using built-in datasets to illustrate the creation of scatter plots and aesthetic mappings.
0 comments
Comments
No comments yet
Be the first to share your thoughts!
Browser Extension
Get instant access to AllDevBlogs from your browser
Top of the Week
1
The Beautiful Web
Jens Oliver Meiert
•
2 votes
2
When your coding agent doesn’t understand your project, you’ll get junk
Benjamin Cane
•
1 votes
3
LLM Use in the Python Source Code
Miguel Grinberg
•
1 votes
4
Wagon’s algorithm in Python
John D. Cook
•
1 votes
5
An example conversation with Claude Code
Dumm Zeuch
•
1 votes