Kubernetes Monitoring Tutorial – Prometheus, Grafana, and Robusta
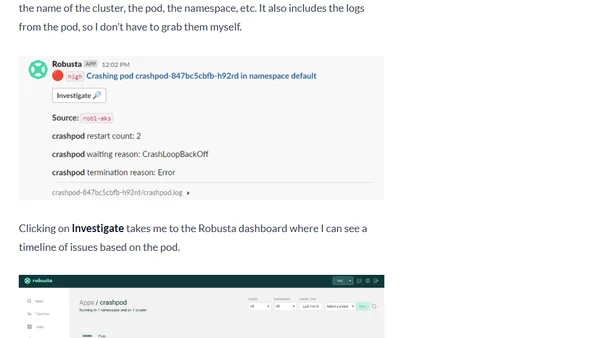
Read OriginalThis article provides a hands-on tutorial for implementing a Kubernetes monitoring solution by integrating Prometheus, Grafana, and the Robusta platform. It discusses the challenges of traditional monitoring, advocates for a toolchain approach inspired by the Linux philosophy, and explains how these tools work together to provide context-aware alerts and actionable insights for operational tasks in a Kubernetes environment.
0 comments
Comments
No comments yet
Be the first to share your thoughts!
Browser Extension
Get instant access to AllDevBlogs from your browser
Top of the Week
1
The Beautiful Web
Jens Oliver Meiert
•
2 votes
2
When your coding agent doesn’t understand your project, you’ll get junk
Benjamin Cane
•
1 votes
3
LLM Use in the Python Source Code
Miguel Grinberg
•
1 votes
4
Wagon’s algorithm in Python
John D. Cook
•
1 votes
5
An example conversation with Claude Code
Dumm Zeuch
•
1 votes