Detailed Guide to the Bar Chart in R with ggplot
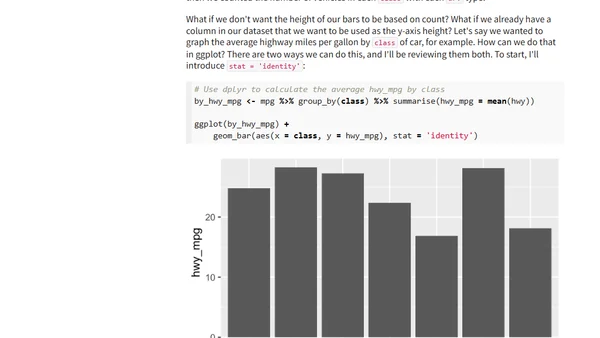
Read OriginalThis article provides a detailed guide to creating bar charts in R with ggplot2. It explains the fundamentals of bar charts, introduces the ggplot2 philosophy, and walks through using the geom_bar function with the built-in mpg dataset. The guide emphasizes mastering basic, effective visualizations and includes a companion workbook for hands-on practice.
0 comments
Comments
No comments yet
Be the first to share your thoughts!
Browser Extension
Get instant access to AllDevBlogs from your browser
Top of the Week
1
The Beautiful Web
Jens Oliver Meiert
•
2 votes
2
When your coding agent doesn’t understand your project, you’ll get junk
Benjamin Cane
•
1 votes
3
LLM Use in the Python Source Code
Miguel Grinberg
•
1 votes
4
Wagon’s algorithm in Python
John D. Cook
•
1 votes
5
An example conversation with Claude Code
Dumm Zeuch
•
1 votes