ECharts for Python
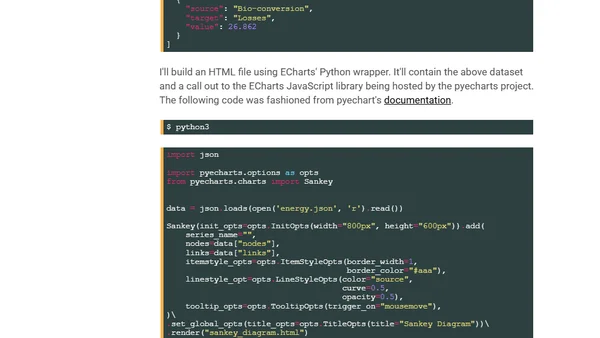
Read OriginalThis technical article explores the Apache ECharts charting library and its Python wrapper, pyecharts. It details the setup process on macOS, demonstrates loading a JSON dataset, and explains how to generate ECharts visualizations in Python and convert them into static images using Chromium. The content is a hands-on tutorial for developers working with data visualization in Python.
Comments
No comments yet
Be the first to share your thoughts!
Browser Extension
Get instant access to AllDevBlogs from your browser
Top of the Week
1
The Beautiful Web
Jens Oliver Meiert
•
2 votes
2
When your coding agent doesn’t understand your project, you’ll get junk
Benjamin Cane
•
1 votes
3
LLM Use in the Python Source Code
Miguel Grinberg
•
1 votes
4
Wagon’s algorithm in Python
John D. Cook
•
1 votes
5
An example conversation with Claude Code
Dumm Zeuch
•
1 votes