Code performance analysis in Visual Studio 2008
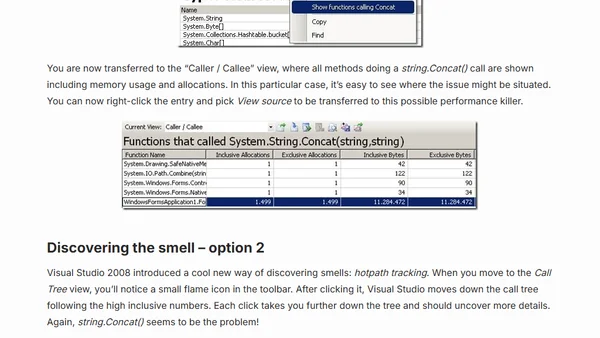
Read OriginalThis article provides a step-by-step guide to using the performance analysis (profiling) tool in Visual Studio 2008. It demonstrates how to profile a simple C# Windows Forms application with a string concatenation inefficiency, showing how to use instrumentation to pinpoint the exact source of a memory performance problem.
Comments
No comments yet
Be the first to share your thoughts!
Browser Extension
Get instant access to AllDevBlogs from your browser
Top of the Week
1
The Beautiful Web
Jens Oliver Meiert
•
2 votes
2
When your coding agent doesn’t understand your project, you’ll get junk
Benjamin Cane
•
1 votes
3
LLM Use in the Python Source Code
Miguel Grinberg
•
1 votes
4
Wagon’s algorithm in Python
John D. Cook
•
1 votes
5
An example conversation with Claude Code
Dumm Zeuch
•
1 votes