Monitoring Dask + RAPIDS with Prometheus + Grafana
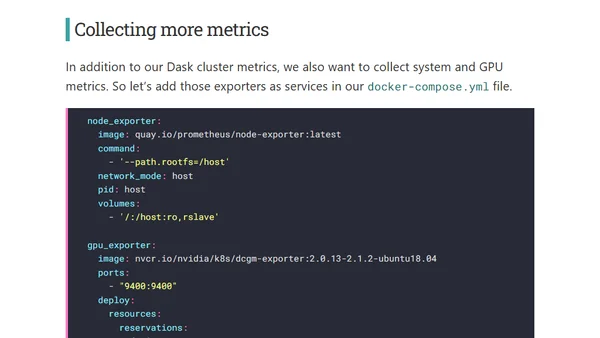
Read OriginalThis technical tutorial explains how to install and configure Prometheus with Grafana to monitor a RAPIDS environment. It covers exporting metrics from the system (node_exporter), GPUs (DCGM-exporter), and Dask's native dashboard, followed by manual Prometheus configuration for a single-host setup using Docker Compose.
0 comments
Comments
No comments yet
Be the first to share your thoughts!
Browser Extension
Get instant access to AllDevBlogs from your browser
Top of the Week
1
The Beautiful Web
Jens Oliver Meiert
•
2 votes
2
When your coding agent doesn’t understand your project, you’ll get junk
Benjamin Cane
•
1 votes
3
LLM Use in the Python Source Code
Miguel Grinberg
•
1 votes
4
Wagon’s algorithm in Python
John D. Cook
•
1 votes
5
An example conversation with Claude Code
Dumm Zeuch
•
1 votes