What Do I Binge Next? A Detailed Overview of the Top 250 TV Shows
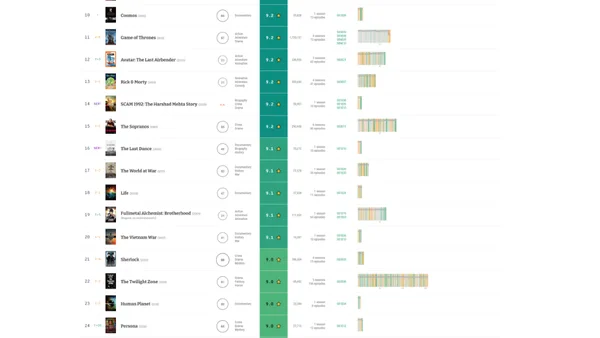
Read OriginalThis article details a data science project visualizing IMDb's top 250 TV shows using R and the RStudio Table Contest. It explains how to create a table showing rankings, ratings, genres, and, most importantly, visual 'trending stripes' to analyze how episode ratings change over a series' lifetime, with examples from Game of Thrones and Bojack Horseman.
0 comments
Comments
No comments yet
Be the first to share your thoughts!
Browser Extension
Get instant access to AllDevBlogs from your browser
Top of the Week
1
The Beautiful Web
Jens Oliver Meiert
•
2 votes
2
When your coding agent doesn’t understand your project, you’ll get junk
Benjamin Cane
•
1 votes
3
LLM Use in the Python Source Code
Miguel Grinberg
•
1 votes
4
Wagon’s algorithm in Python
John D. Cook
•
1 votes
5
An example conversation with Claude Code
Dumm Zeuch
•
1 votes