My Contributions to the First 30 Day Chart Challenge
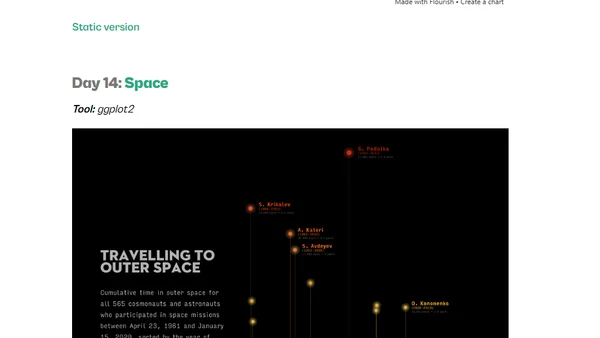
Read OriginalThe author details her participation in the #30DayChartChallenge, a data visualization event for April. She discusses co-organizing the challenge, her goal to use diverse tools beyond her usual ggplot2, and showcases her specific visualizations for the first eight days, created with tools like PowerPoint, Word, ggplot2, DataWrapper, and Figma.
Comments
No comments yet
Be the first to share your thoughts!
Browser Extension
Get instant access to AllDevBlogs from your browser
Top of the Week
1
The Beautiful Web
Jens Oliver Meiert
•
2 votes
2
When your coding agent doesn’t understand your project, you’ll get junk
Benjamin Cane
•
1 votes
3
LLM Use in the Python Source Code
Miguel Grinberg
•
1 votes
4
Wagon’s algorithm in Python
John D. Cook
•
1 votes
5
An example conversation with Claude Code
Dumm Zeuch
•
1 votes