Adding a Line Profiler to My Language
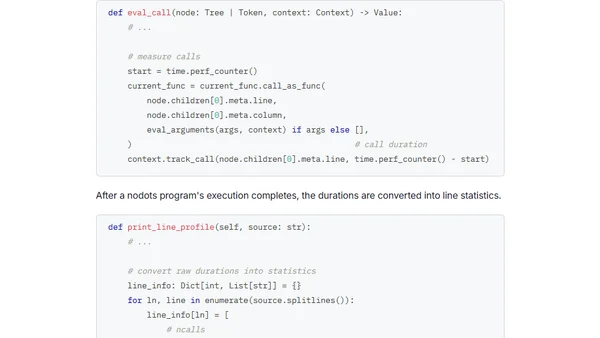
Read OriginalThe article details the process of adding a line profiler to a custom toy programming language called 'nodots'. It explains the motivation for needing performance insights, the implementation of a --profile flag in the CLI, and the internal mechanics of tracking function call durations to display statistics like call count and execution time per line of source code.
Comments
No comments yet
Be the first to share your thoughts!
Browser Extension
Get instant access to AllDevBlogs from your browser
Top of the Week
1
The Beautiful Web
Jens Oliver Meiert
•
2 votes
2
When your coding agent doesn’t understand your project, you’ll get junk
Benjamin Cane
•
1 votes
3
LLM Use in the Python Source Code
Miguel Grinberg
•
1 votes
4
Wagon’s algorithm in Python
John D. Cook
•
1 votes
5
An example conversation with Claude Code
Dumm Zeuch
•
1 votes