Plotting custom models with ggplot2 in R
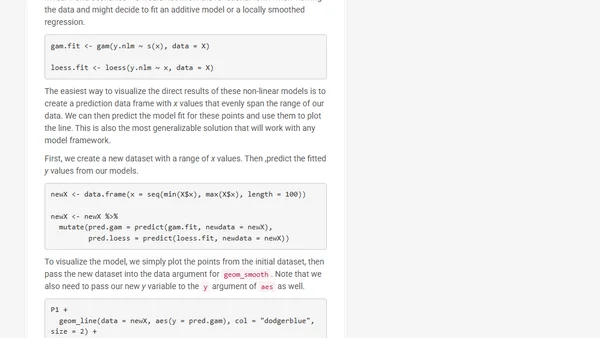
Read OriginalThis technical article explains how to plot custom statistical models in R using ggplot2, moving beyond the default `geom_smooth`. It demonstrates methods for visualizing user-fitted models, starting with simple linear models and progressing to generalized additive models (GAMs) and LOESS fits, using simulated data and prediction data frames.
0 comments
Comments
No comments yet
Be the first to share your thoughts!
Browser Extension
Get instant access to AllDevBlogs from your browser
Top of the Week
1
The Beautiful Web
Jens Oliver Meiert
•
2 votes
2
When your coding agent doesn’t understand your project, you’ll get junk
Benjamin Cane
•
1 votes
3
LLM Use in the Python Source Code
Miguel Grinberg
•
1 votes
4
Wagon’s algorithm in Python
John D. Cook
•
1 votes
5
An example conversation with Claude Code
Dumm Zeuch
•
1 votes