Biomass Pyramids and Funnel Plots in R with GGplot2
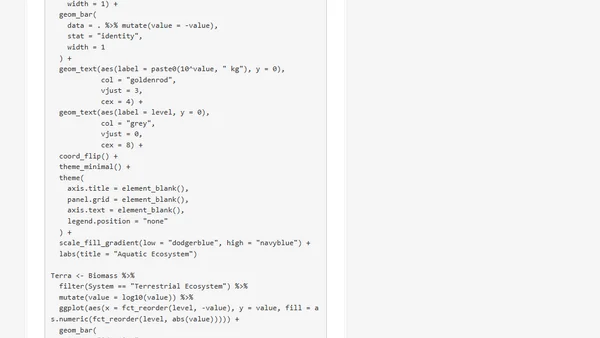
Read OriginalThis technical article demonstrates how to create specialized biomass pyramid and funnel plots using the ggplot2 package in R. It provides step-by-step code examples, including data simulation and customization techniques, to help data scientists and programmers visualize ecological data or similar hierarchical structures programmatically.
0 comments
Comments
No comments yet
Be the first to share your thoughts!
Browser Extension
Get instant access to AllDevBlogs from your browser
Top of the Week
1
The Beautiful Web
Jens Oliver Meiert
•
2 votes
2
When your coding agent doesn’t understand your project, you’ll get junk
Benjamin Cane
•
1 votes
3
LLM Use in the Python Source Code
Miguel Grinberg
•
1 votes
4
Wagon’s algorithm in Python
John D. Cook
•
1 votes
5
An example conversation with Claude Code
Dumm Zeuch
•
1 votes