How to avoid empty line charts
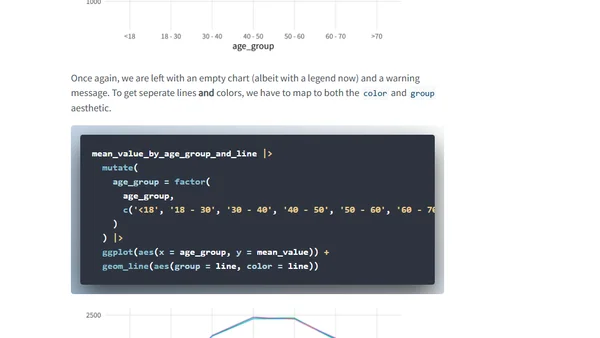
Read OriginalThis article addresses a common problem in R's ggplot2 where line charts render as blank with a warning about groups having only one observation. It provides a step-by-step tutorial using simulated data to diagnose the issue, which often occurs when using categorical variables on the x-axis without proper grouping. The post includes code examples and solutions to create correct visualizations.
Comments
No comments yet
Be the first to share your thoughts!
Browser Extension
Get instant access to AllDevBlogs from your browser
Top of the Week
1
The Beautiful Web
Jens Oliver Meiert
•
2 votes
2
When your coding agent doesn’t understand your project, you’ll get junk
Benjamin Cane
•
1 votes
3
LLM Use in the Python Source Code
Miguel Grinberg
•
1 votes
4
Wagon’s algorithm in Python
John D. Cook
•
1 votes
5
An example conversation with Claude Code
Dumm Zeuch
•
1 votes